Blog Home
The New York Times API, and R
New York Times Search API
The New York Times has several APIs. I used their Article Search API to see if there was a difference in the sentiments expressed in articles, between Democrats and Republicans.
R and Sentiment Analysis
I used R and the tidytext package to perform the sentiment analysis on the snippets/summaries for articles (articles snippets, instead of full summaries, are returned, so when I refer to ‘articles,’ I’m referring to the article snippets). I used the NRC Emotion Lexicon: ‘The NRC Emotion Lexicon is a list of English words and their associations with eight basic emotions (anger, fear, anticipation, trust, surprise, sadness, joy, and disgust) and two sentiments (negative and positive). The annotations were manually done by crowdsourcing.’
Limitations
The API request limit prevented me from examining as much data as I wanted, because the number of results returned for ‘democrat’ and ‘republican’ is, not surprisingly, large. Instead of examining data for full years, I compared data from August 2016 (just before the most recent presidential election), August 2017, and August 2018 (the strange state of politics and current events since the 2016 election).
A first run of results in the search showed that there wasn’t a huge difference between sentiments and emotions expressed between both search terms. (Side note: I then ran search results for coffee, which should have fairly neutral sentiments; and for love and hate, which should show stronger differences in emotions. There were sentiment and emotion differences in articles with love and hate, but they weren’t very dramatic. The comparison gave me a sort of benchmark of percentage differences that might be notable.)
Take-Aways
Here are some of the interesting differences between the sentiments for ‘republican’ and ‘democrat’ articles:
Democrats vs Republicans
-
August 2018: Sadness was expressed 1% more in articles about Republicans than Democrats.
-
August 2017: Fear was expressed 0.9% more in articles about Democrats than Republicans.
-
August 2016:
-
Articles about Democrats were 1% more negative than those about Republicans.
-
Articles about Republicans were 0.8% more positive than those about Democrats.
-
-
Articles about Democrats were more negative than those about Republicans by 1% in both Aug 2016 and Aug 2017.
-
Articles about Democrats were less positive in 2016, and more positve in 2017 and 2018, than those about the Republican party.
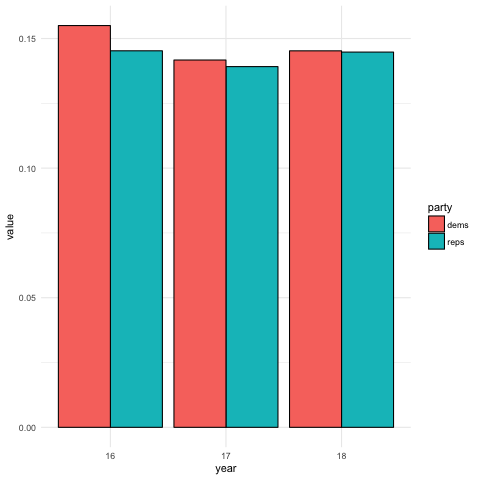
This bar chart shows the percentage of negative articles for Republicans and Democrats for August of each year from 2016-18. The articles were more negative for Democrats than Republicans for all time periods.
Percent of Words with Negative Sentiments by Year and Party

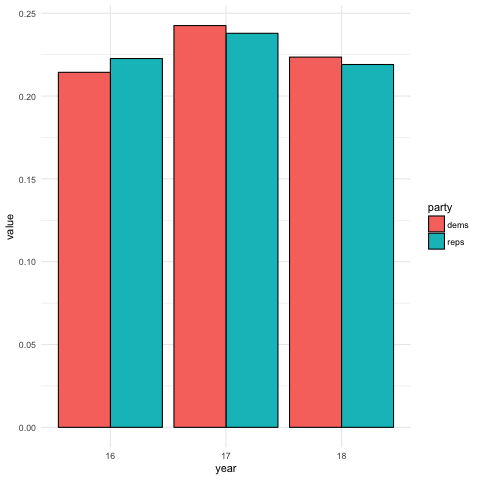
This bar chart shows the percentage of positive articles for Republicans and Democrats for August of each year from 2016-18.The article were more positive for Republicans in 2016 (right before the election?!) and more positive for Democrats in Aug 2017 and Aug 2018.
Percent of Words with Positive Sentiments by Year and Party

(Note: The colors are reversed for colors associated with Dems and Republicans but…details.)
Republicans: Comparisons Across Time
- Articles about Republicans expressed more disgust by 1.5%, in August 2018 compared to August 2017.
Democrats: Comparisons Across Time
-
Articles about Democrats were sadder and more negative, by 1% each, in August 2016 than August 2018.
-
Articles about Democrats were more negative in August 2016 than in August 2017 and August 2018.
Number of Articles
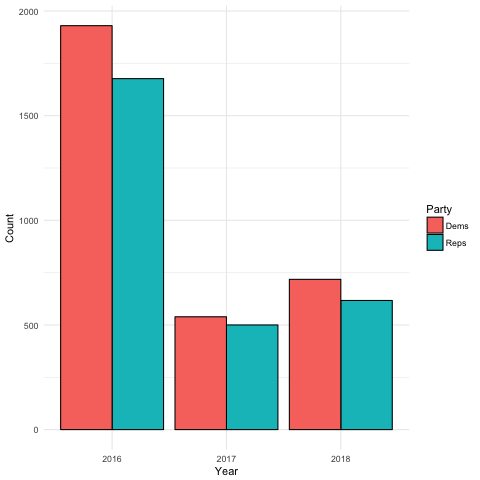
- There were more articles about Democrats than Republicans for each time period compared.
- There were significantly more stories about both parties in August 2016, before the election, in than in August 2017 and August 2018
Number of Articles by Year and Party

Code
The repo for this analysis is here.
The function to retrieve the articles is below, with credit to this article
nyt_df <- function(term,begin_date,end_date, apiKey) {


  baseurl <- paste0("http://api.nytimes.com/svc/search/v2/articlesearch.json?q=",term,
                    "&begin_date=",begin_date,"&end_date=",end_date,
                    "&facet_filter=true&api-key=",api_key, sep="")
  print(baseurl)
  initialQuery <- fromJSON(baseurl)

  maxPages <- round((initialQuery$response$meta$hits[1] / 10)-1)
  pages <- list()
  for(i in 0:maxPages){
    nytSearch <- fromJSON(paste0(baseurl, "&page=", i), flatten = TRUE) %>% data.frame()
    message("Retrieving page ", i)
    pages[[i+1]] <- nytSearch
    Sys.sleep(1)
  }

  allNYTSearch <- rbind_pages(pages)

  allNYTSearch$pubd <- as.Date(allNYTSearch$response.docs.pub_date)

  allNYTSearch$pubmo <- format(as.Date(allNYTSearch$response.docs.pub_date), "%m")

  nyt_snip_nd_mo <- allNYTSearch %>%
    select('response.docs._id', 'response.docs.type_of_material', 'response.docs.word_count', 'response.docs.headline.print_headline', 'response.docs.headline.main', 'response.docs.web_url', 'response.docs.news_desk', 'response.docs.snippet', 'pubmo')

  nyt_snip_nd_mo
}
The function to do the sentiment anaysis is here, with credit to this article for the text mining portion.
artSA <- function(df, colName, term) {

  headlineText <- paste(df[colName], collapse =" ")

  docs <- Corpus(VectorSource(headlineText))

  toSpace <- content_transformer(function (x , pattern ) gsub(pattern, " ", x))
  docs <- tm_map(docs, toSpace, "/")
  docs <- tm_map(docs, toSpace, "@")
  docs <- tm_map(docs, toSpace, "\\|")
  docs <- tm_map(docs, toSpace, "\\‘")
  docs <- tm_map(docs, toSpace, "\\’s")
  docs <- tm_map(docs, toSpace, "\\”")
  docs <- tm_map(docs, toSpace, "\\“")


  docs <- tm_map(docs, content_transformer(tolower))
  docs <- tm_map(docs, removeNumbers)
  docs <- tm_map(docs, removeWords, stopwords("english"))
  docs <- tm_map(docs, removeWords, c("‘", "briefing", "dealbook"))
  docs <- tm_map(docs, removePunctuation)
  docs <- tm_map(docs, stripWhitespace)

  dtm <- TermDocumentMatrix(docs)
  m <- as.matrix(dtm)
  v <- sort(rowSums(m),decreasing=TRUE)
  d <- data.frame(word = names(v),freq=v)

  snip_nrc <- d %>%
    filter(word != 'trump') %>%
    filter(word != 'stormy') %>%
    filter(word != 'john') %>%
    filter(word != 'donald') %>%
    inner_join(get_sentiments("nrc")) %>%
    group_by(sentiment) %>%
    summarise(Frequency = sum(freq))

  percColName <- paste('perc', term, sep='_')
  snip_nrc[percColName] <- snip_nrc$Frequency/sum(snip_nrc$Frequency)

  snip_nrc

}