Blog Home
Presidential Approval Ratings August 2018
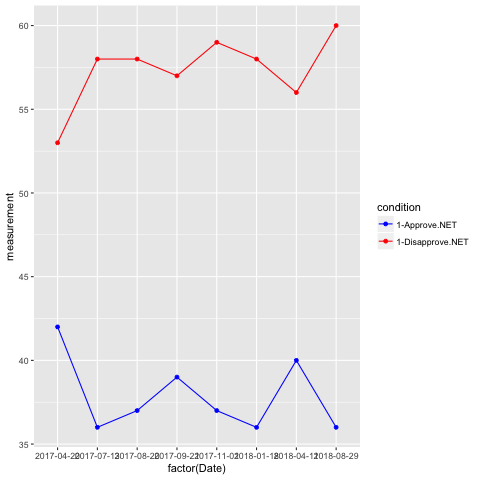
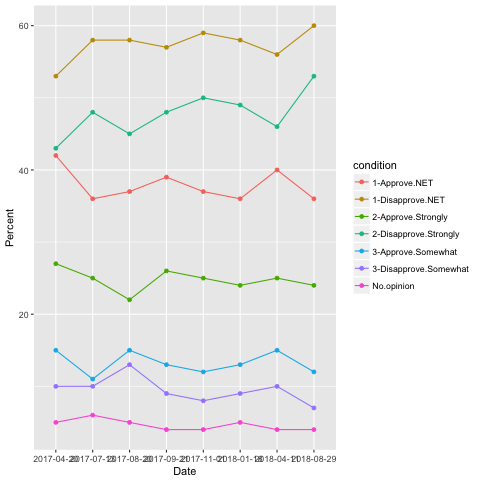
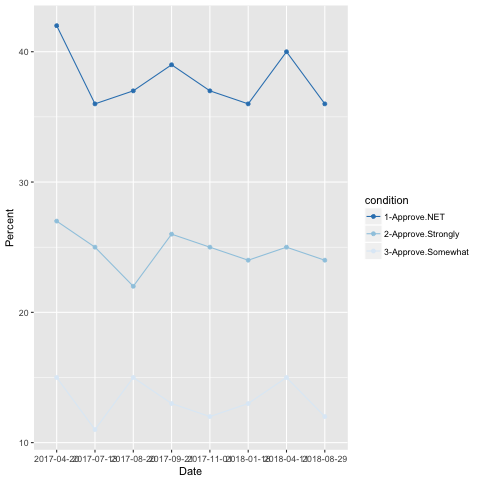
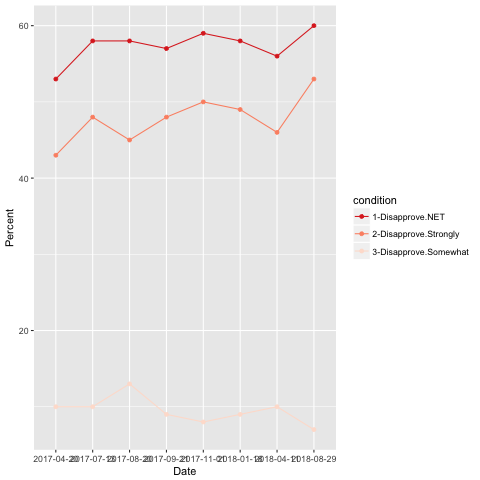
Here are some graphs from the Washington Post-ABC News poll for Presidential approval, from August 26-29, 2018, and showing trends since April 2017.
Net Approval Ratings

All Approval Ratings Results

Approval Ratings Results

Disapproval Ratings Results

The data is here.
The repo is here
  library(ggplot2)
library(tidyverse)

at <- read.csv('approvaltrend.csv')

str(at)

names(at)[2] <- '1-Approve.NET'
names(at)[3] <- '2-Approve.Strongly'
names(at)[4] <- '3-Approve.Somewhat'
names(at)[5] <- '1-Disapprove.NET'
names(at)[6] <- '3-Disapprove.Somewhat'
names(at)[7] <- '2-Disapprove.Strongly'

at$Date <- as.Date(at$Date, format = "%m/%d/%y")

at_long <- gather(at, "condition", "measurement", c("1-Approve.NET", "2-Approve.Strongly", "3-Approve.Somewhat",
                                                    "1-Disapprove.NET", "3-Disapprove.Somewhat","2-Disapprove.Strongly", "No.opinion"))
p_long<-ggplot(at_long, aes(x=factor(Date), y=measurement, group=condition)) +
  geom_line(aes(color=condition))+
  geom_point(aes(color=condition)) +
  labs(x = "Date", y="Percent")

p_long

dev.copy(png,'p_long.png')
dev.off()

at_approve <- gather(at, "condition", "measurement", c("1-Approve.NET", "2-Approve.Strongly", "3-Approve.Somewhat"))

p_approve<-ggplot(at_approve, aes(x=factor(Date), y=measurement, group=condition)) +
  geom_line(aes(color=condition))+
  geom_point(aes(color=condition)) +
  scale_color_brewer(palette="Blues", direction = -1) +
  labs(x = "Date", y="Percent")

p_approve

dev.copy(png,'p_approve.png')
dev.off()

at_disapprove <- gather(at, "condition", "measurement", c("1-Disapprove.NET", "2-Disapprove.Strongly", "3-Disapprove.Somewhat"))

p_disapprove<-ggplot(at_disapprove, aes(x=factor(Date), y=measurement, group=condition)) +
  geom_line(aes(color=condition))+
  geom_point(aes(color=condition)) +
  scale_color_brewer(palette="Reds", direction = -1) +
  labs(x = "Date", y="Percent")

p_disapprove

dev.copy(png,'p_disapprove.png')
dev.off()

at_net <- gather(at, "condition", "measurement", c("1-Approve.NET", "1-Disapprove.NET"))

cbPalette <- c("#FF0000", "#0000ff")

p_net<-ggplot(at_net, aes(x=factor(Date), y=measurement, group=condition)) +
  geom_line(aes(color=condition))+
  geom_point(aes(color=condition)) +
  scale_colour_manual(values=rev(cbPalette))
  labs(x = "Date", y="Percent")

p_net

dev.copy(png,'p_net.png')
dev.off()