Blog Home
R for Data Science: Annotations
From R for Data Science
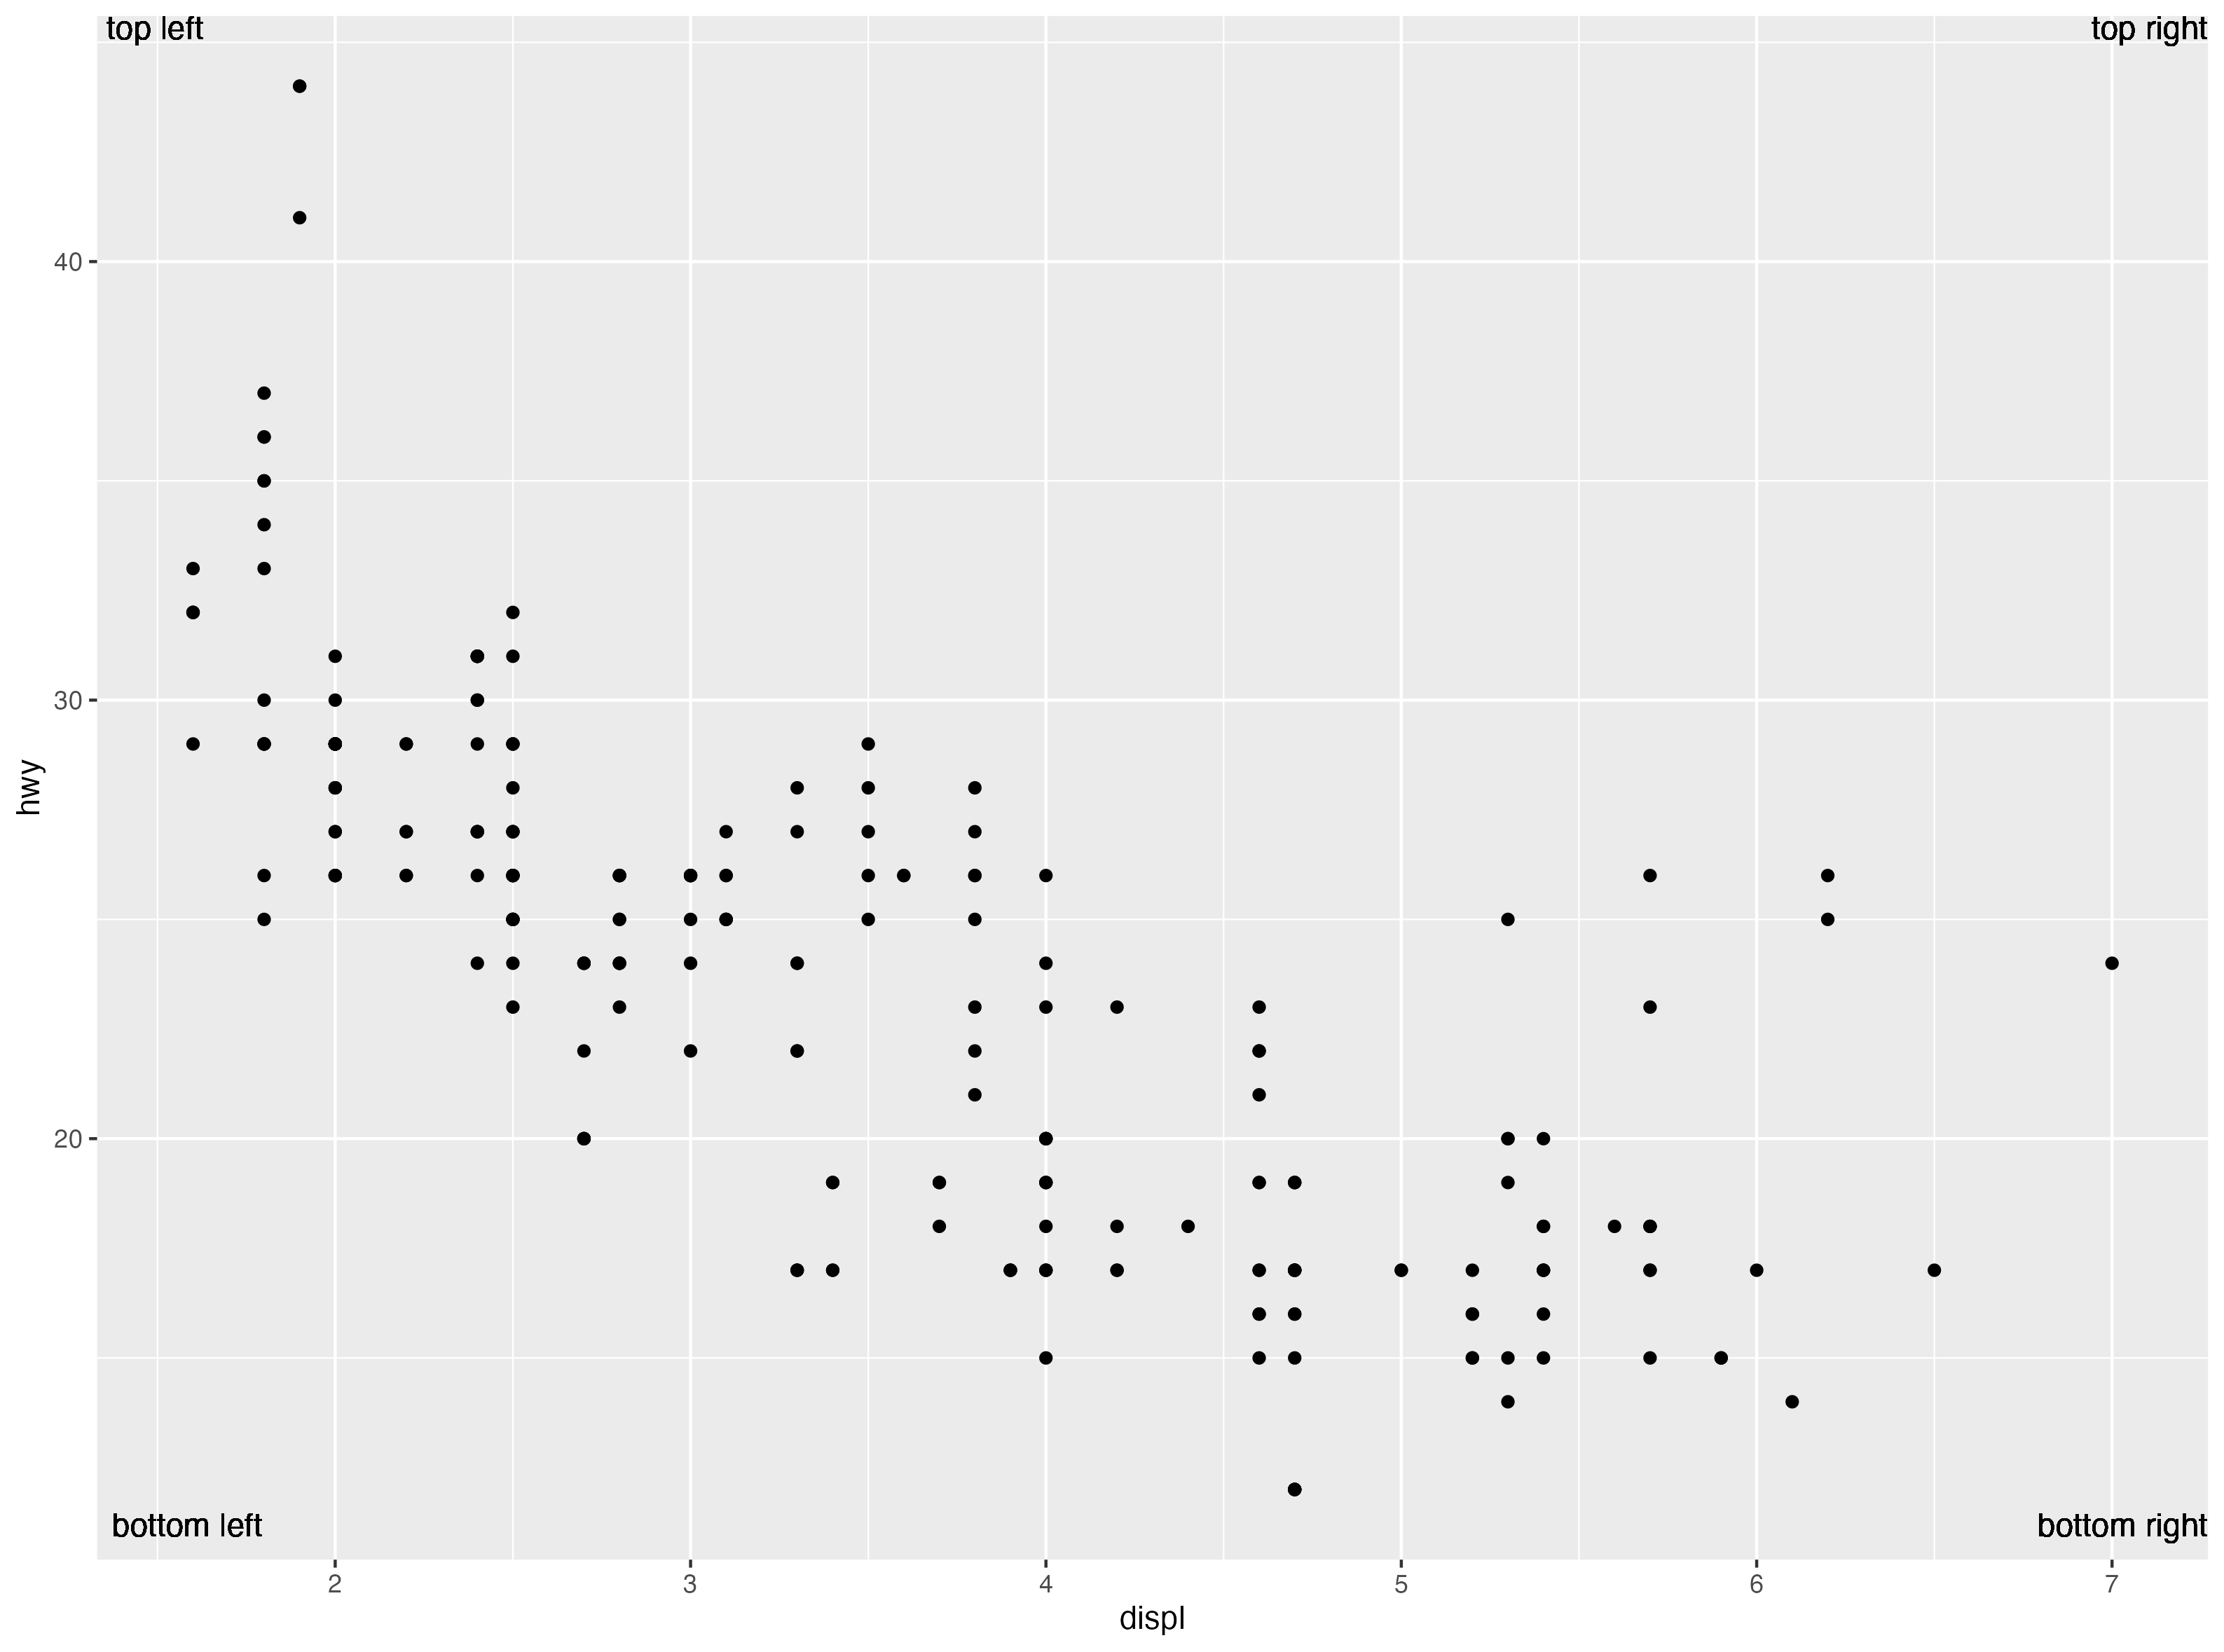
1-Use geom_text() with infinite positions to place text at the four corners of the plot.
ggplot(mpg, aes(x = displ, y = hwy)) +
  geom_point() +
  geom_text(label = "top right", x = Inf, y = Inf, hjust = 1, vjust = 1) +
  geom_text(label = "top left", x = -Inf, y = Inf, hjust = -0.1, vjust = 1) +
  geom_text(label = "bottom left", x = -Inf, y = -Inf, vjust = -1, hjust = -0.1) +
  geom_text(label = "bottom right", x = Inf, y = -Inf, vjust = -1, hjust = 1)

ggsave("r-11-3-1-q1.png")
2-Use annotate() to add a point geom in the middle of your last plot without having to create a tibble. Customize the shape, size, or color of the point.
ggplot(mpg, aes(x = displ, y = hwy)) +
  xlim(0,8) +
  ylim(0,50) +
  geom_point() +
  geom_text(label = "top right", x = Inf, y = Inf, hjust = 1, vjust = 1) +
  geom_text(label = "top left", x = -Inf, y = Inf, hjust = -0.1, vjust = 1) +
  geom_text(label = "bottom left", x = -Inf, y = -Inf, vjust = -1, hjust = -0.1) +
  geom_text(label = "bottom right", x = Inf, y = -Inf, vjust = -1, hjust = 1) +
  annotate(
     geom = "point",
     size = 5,
     x = 4,
     y = 25,
     color = "red") +
    annotate(
     geom = "text",
     label = "center",
     size = 5,
     x = 4,
     y = 25,
     vjust = 1.2,
     color = "red")

ggsave("r-11-3-1-q2.png")

3-How do labels with geom_text() interact with faceting? How can you add a label to a single facet? How can you put a different label in each facet? (Hint: Think about the dataset that is being passed to geom_text().)
ggplot(mpg, aes(x = displ, y = hwy)) +
  geom_point() +
  facet_wrap(~drv) +
  geom_text(data = mpg |> filter(drv == "f"), x = 4, y = 40, label = "f", color = "blue", size = 10) +
    geom_text(data = mpg |> filter(drv == "4"), x = 4, y = 40, label = "4", color = "blue", size = 10)  +
    geom_text(data = mpg |> filter(drv == "r"), x = 4, y = 40, label = "r", color = "blue", size = 10)

ggsave("r-11-3-1-q3.png")

4-What arguments to geom_label() control the appearance of the background box?
- label.padding - Amount of padding around label. Defaults to 0.25 lines.
- label.r - Radius of rounded corners. Defaults to 0.15 lines.
- label.size - Size of label border, in mm.
- within mapping, colour, fontface, etc.
p <- ggplot(mtcars, aes(wt, mpg, label = rownames(mtcars)))

p + geom_label(mapping = aes(fill = factor(cyl)), colour = "white", fontface = "bold",
  label.padding = unit(0.5, "lines"),
  label.r = unit(0.5, "lines"),
  label.size = 0.5)

ggsave("r-11-3-1-q4.png")

5-What are the four arguments to arrow()? How do they work? Create a series of plots that demonstrate the most important options.
anglechanges the angle of the triangle point on the arrowtypechanges whether the triangle is filled or not (open or closed)lengthchanges how big the arrow triangle isendschanges the position of the arrow triangle, either on both ends, first, or last on the arrow segment
p <- ggplot(mpg, aes(x = displ, y = hwy)) +
  geom_point()


p +  annotate(
          geom = "segment",
          x = 3, y = 35, xend = 5, yend = 25, color = "blue",
          arrow = arrow(angle = 60, type = "closed", length = unit(0.5, "inches"), ends="first")
        )

ggsave("r-11-3-1-q5_1.png")

p +  annotate(
          geom = "segment",
          x = 3, y = 35, xend = 5, yend = 25,color = "blue",
          arrow = arrow(angle = 10, type = "open", length = unit(1, "inches"), ends="last")
        )

ggsave("r-11-3-1-q5_2.png")

